Features
Contents
Basic Features
Open file
The easiest way is to start the SignalConstructor and drag & drop file into application.
or
Menu File → Open,
Note
Has been observed that this dialog might be slow on the network drives.
Note
Dialog supports favorite folders, just move folder to the left side of dialog.
Change zoom
Press the left mouse button on the ruler, and then pull.
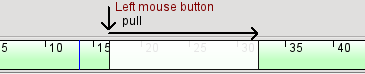
- Right click on the ruler set zoom back to 100%
- Mouse wheel changes zoom smoothly
- Ctrl+mouse wheel (with mouse cursor on waveform) [1]
- Background color of the ruler depends on the sample rate.
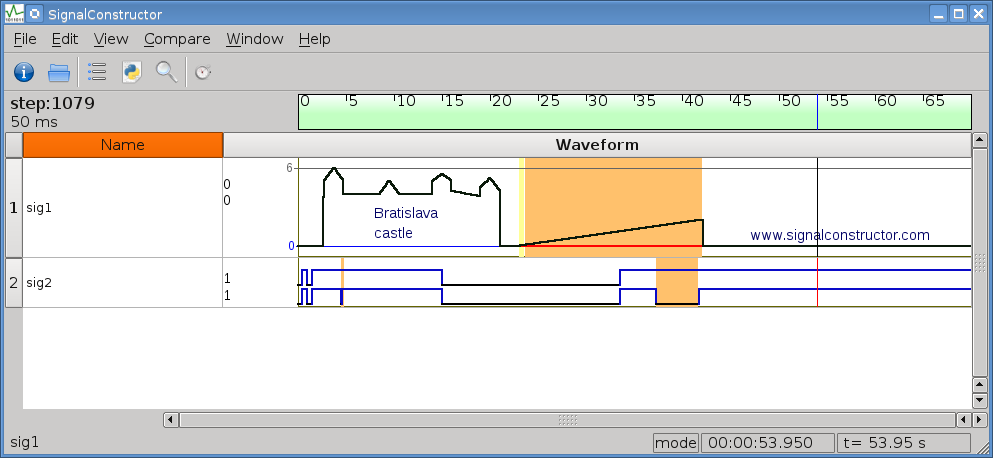
In case of the hihg zoom on signals, are visible red dots, to represent values.
Footnotes
| [1] | Like in Firefox |
Moveable time cursor
Hold the left mouse button pressed to move it, or just click on the signal waveform to change time position.
Actual value under cursor is shown on the left side of the graph.
On the digital signal, in the case that cursor is directly on the edge, the green square dot is shown, to higlight edge position.
Time Cursor is moveable by keyboard:
| Key | Action |
|---|---|
| → | one step right |
| ← | one step left |
| ↑ | +1 second |
| ↓ | -1 second |
| Home | t = 0 |
| End | t = end |
| j | jump dialog |
Time meter (stopwatch)
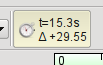
Click on the stopwatch icon, to show time difference between old and new cursor position.
| Key | Action |
|---|---|
| t | toogle time button on/off |
Hide signal
Select one or more signal, → Hide
Hidden signals could bee unhiden via search and show dialog
Search and show
Unset/Set signal checkbox to hide/unhide signal.
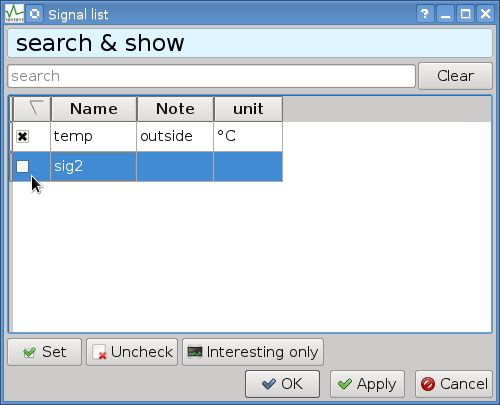
Use filter to show only filtered signals.
Use button Set, to show filtered signals
Button Unset, hide filtered signals
Button Interesting only hides constant signals
Tip
Doubleclick on signal item navigate (higlight) coresponding signal name, if signal is visible
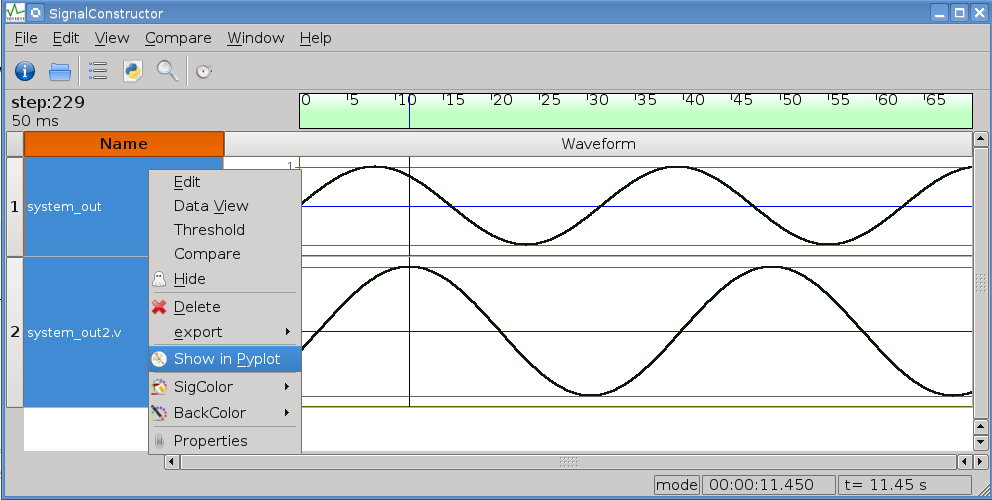
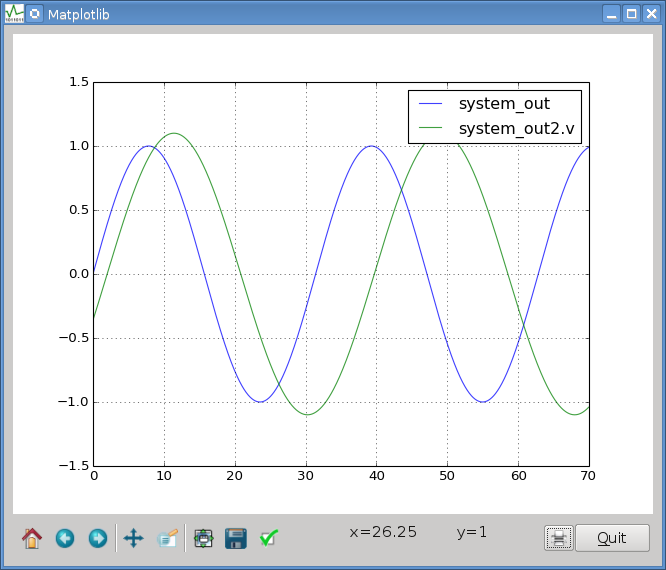
Matplotlib view
Select one or more signals, choose Show in Pyplot from right click menu
Matplotlib view
Features accesible via icons:
- Reset original view
- Back to previous view
- Forward to next view
- Pan axes with left mouse button, zoom with right
- Zoom to rectangle
- Save the figure
- Edit curves line and axes parameters
Tip
Via “Edit curves line and axes parameters” is possible to set logaritmic view.
menu → File → Print Prints graphs into a .pdf file.
(to the same directory where is the waveform file)
Plugins
SignalConstructor support external plugins written in python language.
Access to waveform data is possible via input parameter of plugin_main function
def plugin_main(*args, **kwargs):
    print args, kwargs

    msg = QtGui.QMessageBox()
    msg.setText('hello word from plugin :)')
    msg.exec_()

    return 42
Compare signals
Is possible to compare two files, with same signal names.
-
Open file
-
Open second file via menu -> Compare -> Load file
or drag and drop file into window with right button.
Attention!
- only equal signal names are compared
- signal are automatically resized/resampled